MT4 & MT5 Genesis
MT4 & MT5 Genesis is a comprehensive suite of MetaTrader trading tools that enhance the power of the standard MetaTrader platform and work on Forex, Indices, and Commodities.
Over the last 10 years of providing MetaTrader to clients around the globe, we identified a handful of key add-ons which would greatly assist our traders in how they place trades, manage risk, and look for new trading opportunities.
Here are some of the advantages of upgrading to MT4 & MT5 Genesis:
- Access a professional suite of MetaTrader add-ons to enhance your experience
- Make use of the sophisticated order management system
- Receive alerts and never miss a trading opportunity again
MT4 & MT5 Genesis are a series of Expert Advisors (EAs) which can be easily applied to your live MetaTrader trading account with a few clicks.

Easily manage your trades and your trading account with the terminal window.
Written Instructions
This video will show you how to use the Trade Terminal. MT4 Genesis will need to be installed before you can follow this tutorial.
Getting started:
- Head over to the Navigator and open Expert Advisors if it is not already open.
- Click and drag SRS Tradings – Trade terminal over your desired chart.
- Click OK. The Trade Terminal window will now be applied.
Undock the window:
Maximise the Trade Terminal window, then click Settings >> Undock terminal under Open and pending orders. This opens the window outside of MT4 so that it can be manipulated, opened and closed at will. You will then be able to freely change the window size.
Buy or sell an FX pair or CFD:
Click either the Buy or Sell button on a given FX pair or CFD. Please be careful with these quick order options.
Account Information & Setting Alarms
Located on the right-hand side of the Trading Terminal. See your Balance, Equity, Floating P/L, Free Margin, Margin in Use, Open Positions, Pending Orders and Pips Profit. Set alarms on any of these figures by clicking the bell button, filling out the form and clicking Save.
Open and Pending Orders window:
To see all orders, click Pending Orders and change it to All Orders.
Under the Close tab, you’ll have the option to Close all, Close open positions, Delete pending orders, Close all winners, and Close all losers. To execute a partial close, select Tools, then either All orders or Selected orders and then Partial close. From here, select your desired percent. Through this tools menu, you can also add a Stop Loss (S/L), Take Profit (T/P), Trailing stop, Break-even exit, or Automated close to some or all of your orders.
Automated Close is a great tool unique to Trade Terminal that allows you to create your own set of close conditions for a given order. You can even partially close under certain conditions, then set the Stop Loss, Take Profit, alarm, etc. when one of these conditions is met. Automated closes may be saved as templates to be used again later.
If you have set one of these options, a tools icon with an exclamation mark will appear beside the order. If you click this and then click “Tasks in progress”, you can alter any Tools adjustments you have made to the order.
Break-even exit:
Selecting this for a given order will cause the system to take you out of a trade at your original opening price, should your original opening price be reached.
Add the Mini Terminal to organise your charts and access trade management tools directly from your charts.
Written Instructions
This video will show you how to use the Mini Terminal. Genesis will need to be installed before you can follow this tutorial.
Getting started:
- Head over to the Navigator and open Expert Advisors if it is not already open.
- Double click SRS Tradings – Mini terminal.
- Click OK. The Trade Terminal window will now be applied.
Making an order:
For a simple at-market-value order, click either the Buy or Sell button on a given FX pair or CFD. Please be careful with these quick order options. The Mini Terminal also allows you to adjust how many lots you’re buying, your Stop Loss (S/L), Trailing Stop (T/S) and Take Profit (T/P).
Closing orders:
Click on the number next to the Symbol and then choose one of the order options. Keep in mind that this will affect all orders within that Symbol, not any orders outside of that Symbol. For example, if you clicked Close all winners on EURUSD, all winning EURUSD positions would be closed, but any other winning positions, for example in AUDUSD and USDJPY, will remain open.
More advanced options:
Click the yellow square icon to create a new order. Here, you can create Buy Limit, Sell Limit, Buy Stop and Sell Stop orders. You can also create OCO breakout orders, which we’ll talk about in a minute. Limit orders allow you to automatically buy or sell at a certain market value.
OCO Breakout
OCO means one cancels other. This is particularly useful for people who trade on news events. If you believe the market will move violently but you are not sure in which direction, you can use this to place both a buy stop and a sell stop order simultaneously. When one order is triggered, the other is cancelled.
Undocking Mini Terminal
Click the red square cog button to open Tasks and settings, then click Undock terminal. This will undock the mini terminal and the entire chart from MetaTrader, allowing you to manipulate the new window independently from the MetaTrader program. You can also redock the window under Tasks and settings.
Get market insights and track market sentiment with the Sentiment Trader.
Written Instructions
This video will show you how to use the Sentiment Trader. Genesis will need to be installed before you can follow this tutorial.
Getting started:
- Head over to the Navigator and open Expert Advisors if it is not already open.
- Double click SRS Tradings – Sentiment Trader, or click and drag it onto your desired chart.
- Click OK. The Trade Terminal window will now be applied.
What does the Sentiment Trader show me?
The Sentiment Trader shows current sentiment of a given market on the top graph and a candlestick chart of historical sentiment plotted against the current price action. The top graph may be changed in style by clicking one of the buttons attached to it, and the bottom chart may be changed to your desired timeframe using the buttons at the bottom of the window.
Clicking on Symbols at the top of the Sentiment Trader window will allow you to see all of your symbols in list order. This includes current market sentiment, your position size and whether it’s long or short (if applicable), and your running P/L.
Spot new trading opportunities and cut down on money management errors with the Correlation Trader.
Written Instructions
This video will show you how to use the Correlation Trader. Genesis will need to be installed before you can follow this tutorial.
Getting started:
- Head over to the Navigator and open Expert Advisors if it is not already open.
- Double click SRS Tradings – Correlation Trader, or click and drag it onto your desired chart.
- Click OK. The Trade Terminal window will now be applied.
- If the window is too small, you may wish to make it wider by clicking and dragging on the side of the window.
Reading the correlation:
The first thing you will see is a comparison between the two different charts and a graph in between them showing what percentage of correlation they have. For example, a correlation of 90% would show that the two charts are heavily correlated with one another, whereas a correlation of -90% would show that the charts are correlated in opposite directions. A correlation of 0% would indicate that there is no correlation between the two instruments, at least in technical terms. The timeframe of the charts can be changed next to this correlation figure.
Making an order:
All you need to do is look for the New order link at the top of the Correlation Trader window and click it. You will be able to set the Volume, Stop Loss (S/L) and Take Profit (T/P) for your order. A non-hedging facility is also provided.
Never miss the start of a trading session with the interactive Session Map.
Written Instructions
This video will show you how to use the Session Map. Genesis will need to be installed before you can follow this tutorial.
Getting started:
- Head over to the Navigator and open Expert Advisors if it is not already open.
- Double click SRS Tradings – Session map, or click and drag it onto your desired chart.
- Click OK. The Trade Terminal window will now be applied.
Reading the map
The Session Map shows you the current platform time with the red line, along with opening hours at major exchanges in Sydney, Tokyo, London, and New York. When the red line crosses over one of these exchanges and it is highlighted in blue, the exchange is currently open.
Your account information and floating Profit and Loss (P/L) are displayed at the top-left hand corner.
News events are scattered along the bottom of the window. Red is high impact, yellow is medium impact, and grey is low impact. Hover over a news event to see more information.
Use the powerful Alarm Manager trade notification tool which can also trade automatically for you.
Written Instructions
This video will show you how to use the Alarm Manager. Genesis will need to be installed before you can follow this tutorial.
Getting started:
- Head over to the Navigator and open Expert Advisors if it is not already open.
- Double click SRS Tradings – Alarm Manager, or click and drag it onto your desired chart.
- Click OK. The Trade Terminal window will now be applied.
Using the EA
Some alarms have already been made for you. You can turn them on and off using the switches on the right-hand side of the window. To create a custom alarm, just hit the + button above one of the categories to get started.
Ideas for custom alarms
- Warn you on screen (or by email or SMS) if your margin usage exceeds 20%
- Close all losing positions if drawdown on your account exceeds 10%
- Send a message to followers on Twitter (or email or SMS) every time you trade
- Automatically place orders or close positions at a time in the future, e.g. “at 2pm” or “in 30 minutes time”
- Warn yourself if you have open positions without a stop loss
- Automatically place orders or close positions based on technical indicators such as RSI or moving average crosses
- Send a message to followers on Twitter whenever there is a new 30-day high in an instrument
- Display a message congratulating yourself if you have 3 consecutive winning trades
- Remind yourself to stop trading if you have 4 consecutive losing trades, or if your balance declines by more than 3%, or if your win/loss % falls below 30%
- Show a message 10 minutes before high-impact events in the economic calendar
- Place a new order when RSI is above 70 on three different timeframes
- Place a new order if RSI goes above 70 or there is a MACD cross of the signal line
Stay up-to-date with your favourite news feeds, gain insights from traders on Twitter and view the Economic News Calendar all in the same space.
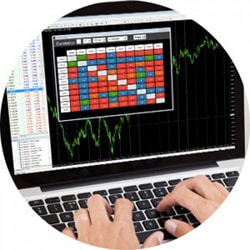
Visualise correlation scores and the strength of specific patterns without any separate spreadsheets with the Correlation Matrix.
Written Instructions
This video will show you how to use the Correlation Matrix. Genesis will need to be installed before you can follow this tutorial.
Getting started:
- Head over to the Navigator and open Expert Advisors if it is not already open.
- Double click SRS Tradings – Correlation Matrix, or click and drag it onto your desired chart.
- Click OK. The Trade Terminal window will now be applied.
Reading the chart
Correlation is measured on a scale from -100 to +100. A high positive number means the prices of two instruments have been moving identically to one another in the given time frame. A high negative number means they have been moving in opposite directions. A reading of 0 means they are moving independently.
Change symbols in the matrix
Click the … button to add or remove symbols.
Changing timeframes
The timeframe may be changed using the dropdown menus at the top of the window.


